Use Cases
Docs
Blog Articles
BlogResources
Pricing
PricingStreaming analytics on NYC Taxi Trips

VP Product, InfinyOn Inc.
Index
Introduction
If I am real, the most difficult aspects of working in data platforms for me is the sheer volume of noise that is out there in the ecosystem. Hypes, fads, misuse of terms, misrepresentation of capability. It’s all out there.
In the midst of all that, the hardest questions to precisely answer for a data platform are - What does the product do? Who is it for? Why does it matter?
These questions may seem trivial. And at times frustrating to go round in circles while trying to clearly answer them. But it is absolutely critical to answer these questions with a high degree of precision and integrity.
Answering the questions is not enough either. Talk is cheap. It’s essential to show and prove the claims.
My intent in this blog is to show and tell. First I will share an end end streaming analytics data flow. And then I will provide the answer to the 3 questions.
We will go from a streaming variant of the TLC Trip Record Data from the NYC Taxi & Limousine Commission to processed streams which can be queried using SQL, and visualized in a real-time dashboard.
NY Transit dataflow
Clone the Git repository containing the examples to follow along: https://github.com/infinyon/stateful-dataflows-examples/tree/main
We will implement the dataflow in this directory: https://github.com/infinyon/stateful-dataflows-examples/tree/main/dataflows/ny-transit
The New York transit dataflow demonstrates how to create tables, use the SQL query interface to analyze the data, and launch a visualization tool to evaluate the results.
The source of the data and the schemas can be found at the following links:
In the initial flow of the project, I am using:
- Fluvio for event streaming
- Stateful DataFlow for stateful stream processing
- Rust for writing the data processing logic
- SQL within Stateful DataFlow to query streaming tables
- Python for for real-time visualization
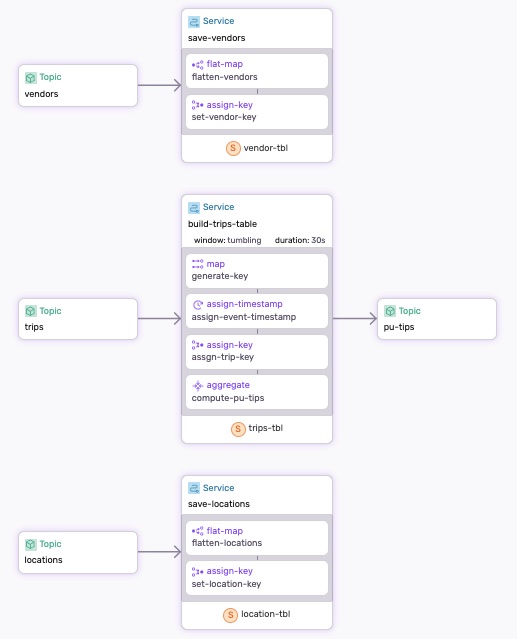
The diagram represents the flow of the project.

The Dataflow
The dataflow.yaml defines three services that handle the save-vendors, save-locations, and build-trips-table data. The vendors and locations topics store static data, while the trips topic stores event data.
The build-trips-table service performs two key functions:
- It creates a
trips_tbl, which is refreshed every 30 seconds. - It computes the average tips per zone and writes the result to
pu-tipstopic (pu= Pick-up).
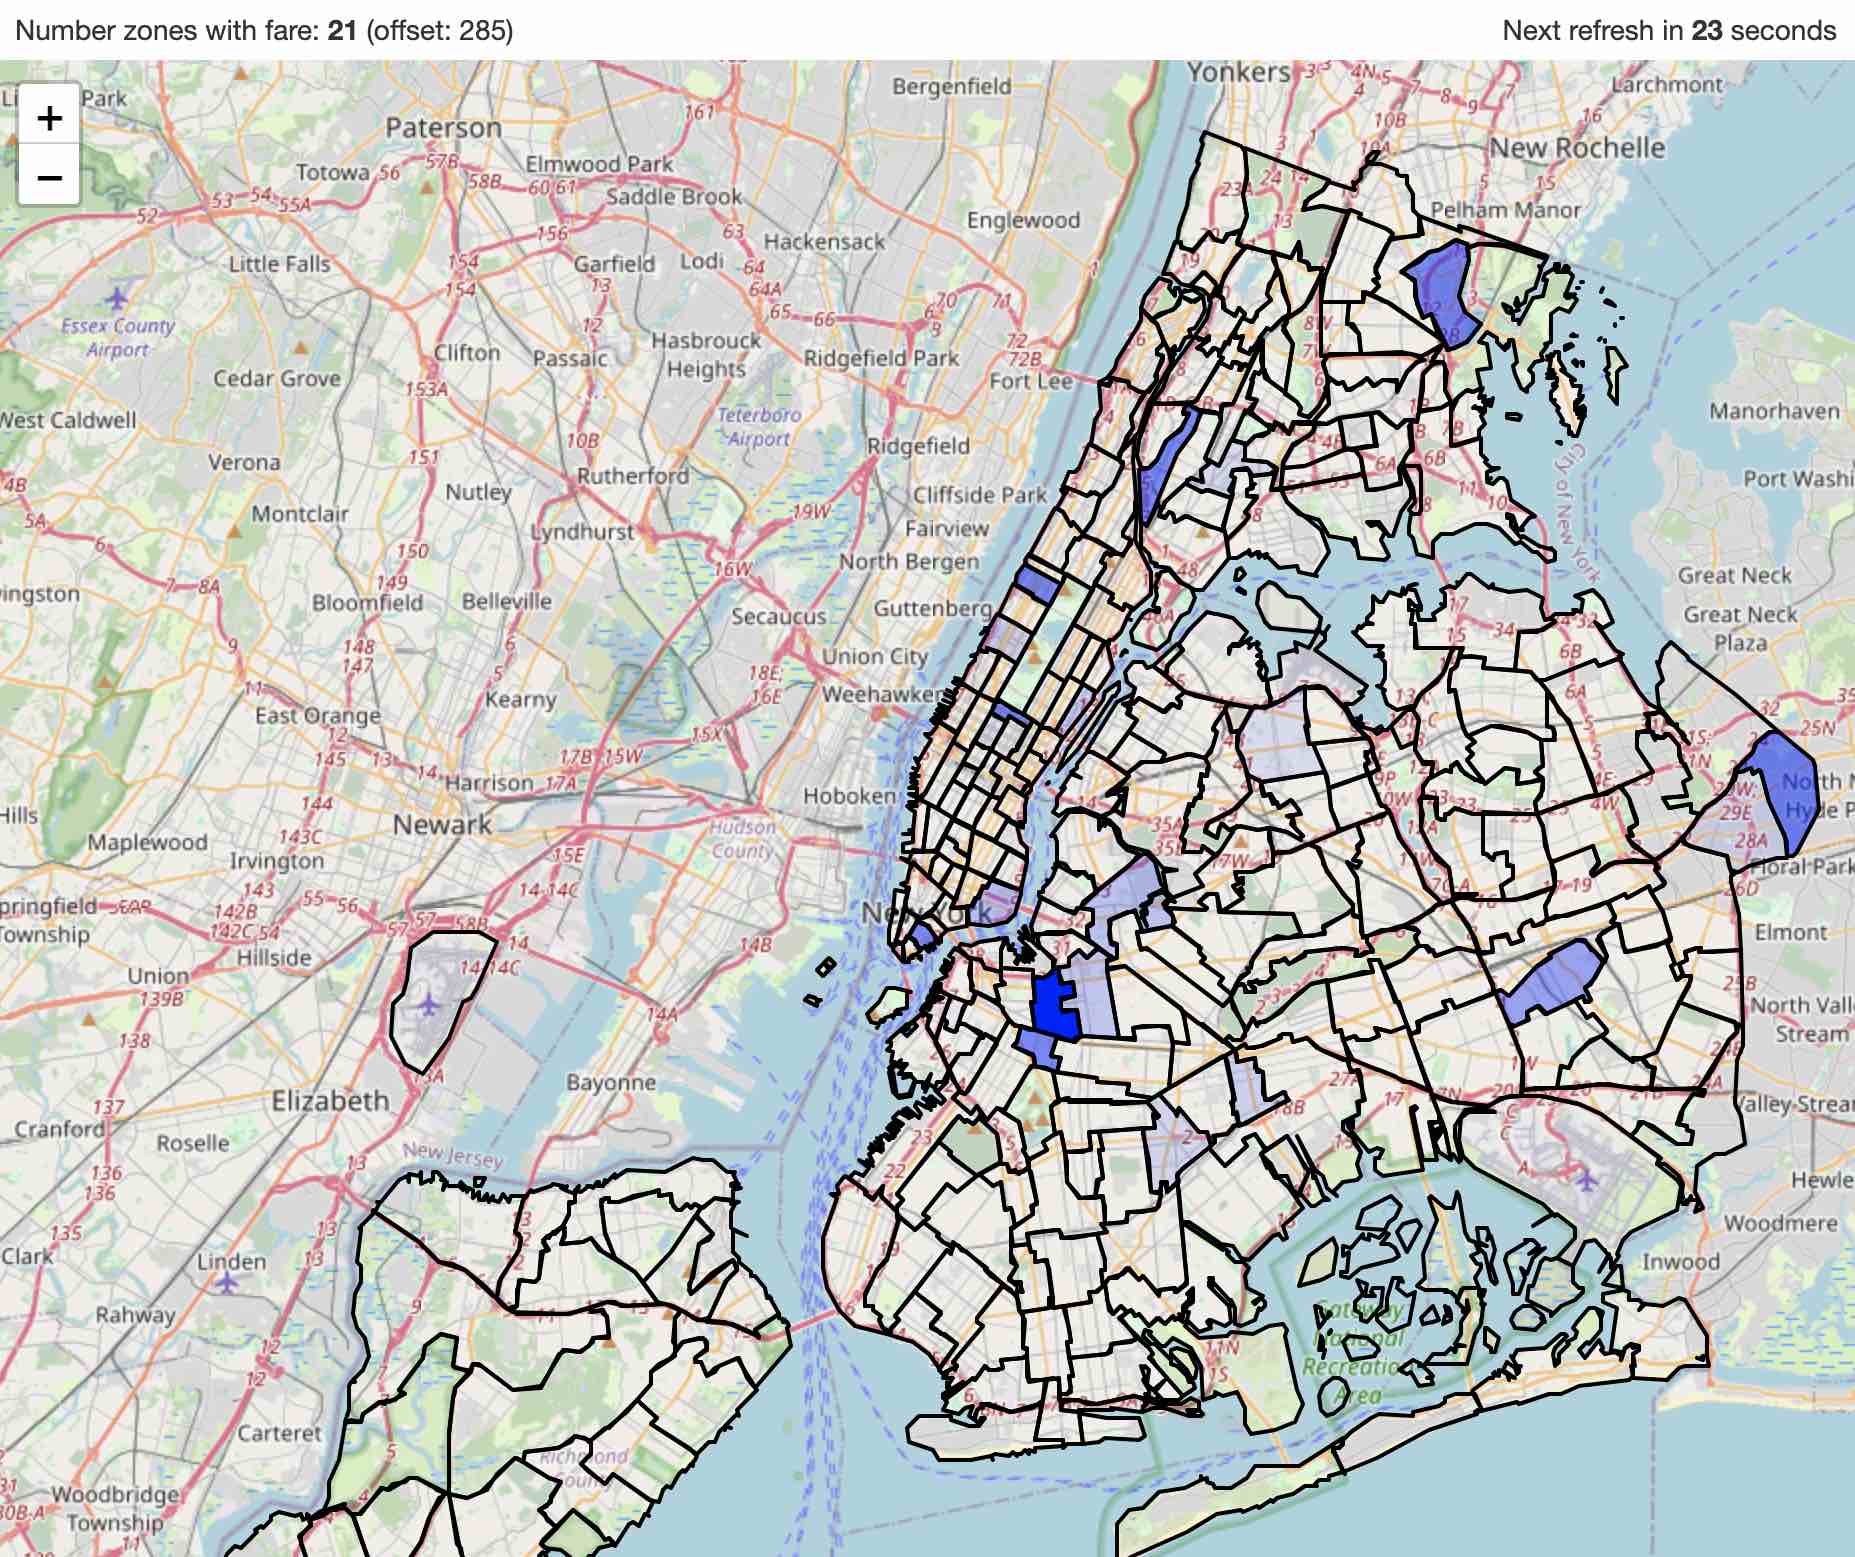
The pu-tips topic is used by the visualization tool to display the average tips per zone. The darker the color, the higher the average tip.

Step-by-step
Make sure to Install SDF and start a Fluvio cluster.
1. Run the Dataflow
Use sdf command line tool to run the dataflow:
sdf run --ui
- Use
--uito generate the graphical representation and run the Studio. - Using
sdf runas opposed tosdf deploywill run the dataflow with an ephemeral worker, which will be cleaned up on exit.
Note: It is important to run the dataflow first, as it creates the topics for you.
2. Read the locations & the zones:
Read locations from the data generator and add them to the locations topic:
curl -s https://demo-data.infinyon.com/api/ny-transit/locations | fluvio produce locations
Read vendors from the data generator and add them to the vendors topic:
curl -s https://demo-data.infinyon.com/api/ny-transit/vendors | fluvio produce vendors
3. Start the http connector:
In a new terminal change directory to ./connectors, download the connector binary, and start connector:
cd ./connectors
cdk hub download infinyon/[email protected]
cdk deploy start --ipkg infinyon-http-source-0.4.3.ipkg -c trips-connector.yaml
The NY transit connector receives 10 events per second. Use fluvio to see the events streaming in real-time:
fluvio consume trips
Use
4. Use SQL interface to explore the trips_tbl table
The dataflow creates the trips_tbl table that gets refreshed every 30 seconds.
SDF offers a sql interface to explore the table. Just type sql in the terminal to get started:
>> sql
To show tables, type show tables; and hit enter:
SHOW tables
Let’s compute total fares, tips, tolls, and driver_pay for all rides:
SELECT
  count(*) AS rides,
  sum(`base-passenger-fare`),
  sum(tips),
  sum(tolls),
  sum(`driver-pay`)
FROM
  trips_tbl
Or identify the number of riders who paid congestion surcharge:
SELECT
  count(*) AS rides,
  sum(`base-passenger-fare`),
  sum(`congestion-surcharge`)
FROM trips_tbl t
WHERE t.`congestion-surcharge` > 0
If we are a driver, we want to know whe pick-up zone that has the highest average tip:
SELECT
  `pu-location-id` AS pu_zone,
  avg(tips) as average_tip
FROM trips_tbl
WHERE tips > 0.0
GROUP BY `pu-location-id`
ORDER BY average_tip DESC
Unfortunately, the pick-up zone is not human-readable, but we can join the trips_tbl table with the location_tbl table to get the zone name:
SELECT
  `pu-location-id` AS pu_zone,
  l.zone as pu_zone_name,
  avg(tips) as average_tip
FROM trips_tbl t
JOIN location_tbl l
ON t.`pu-location-id` = l.location
WHERE tips > 0.0
GROUP BY l.zone, `pu-location-id`
ORDER BY average_tip DESC
We are also interested in determining which vendor receives the highest average tip—Uber or Lyft. To achieve this, we need to perform a 3-way join between the trips_tbl, location_tbl, and vendor_tbl tables:
SELECT
  `pu-location-id` AS pu_zone,
  l.zone as pu_zone_name,
  avg(tips) as average_tip,
  v.name as vendor
FROM trips_tbl t
JOIN location_tbl l
  ON t.`pu-location-id` = l.location
JOIN vendor_tbl v
  ON t.`hvfhs-license-num` = v._key
WHERE tips > 0.0
GROUP BY l.zone, `pu-location-id`, v.name
ORDER BY average_tip DESC
Feel free to explore the data further.
To exit the sql interface, type .exit.
5. Visualize the data
While tables are useful, they can be challenging to interpret. That’s why we developed a visualization tool to make understanding the data easier and more intuitive.
Create the virtual environment
python3 -m venv venv
Activate the virtual environment
source venv/bin/activate
Install the required packages
pip install geopandas folium matplotlib fluvio
Run the script
python3 plot.py
Open browser on “index.html” to see the map.
On mac:
open index.html
The map will continously update with the latest data from the Fluvio topic every 30 seconds.
Clean-up
Exit sdf terminal and clean-up. The --force flag removes the topics:
sdf clean --force
Stop the connector:
cdk deploy shutdown --name trips-connector
Why InfinyOn
Why: InfinyOn exists to empower engineers to build efficient, secure, reliable, streaming analytics applications fast.
The current state of data processing infrastructure is fragemented, complicated, inefficient, and expensive. Somehow with the epochs of innovation in technology and better levels of abstraction, we have lost touch of the basic first principles of computer science like I/O, Compute, Network.
The existence of InfinyOn is from the ashes of frustrations and battle scars of building large scale distributed data intensive applications in high frequency trading, network monitoring, cyber security, surveillance tech, autonomous drones and driving, ecommerce insights, and more.
We believe that Rust is a fundamentally better programming language to build memory safe systems without the baggage of garbage collection.
We believe that WebAssembly is a significant upgrade on the JVM for secure, sandboxed, edge compute.
We believe in mechanical sympathy and well architected systems as foundations of data intensive applications.
We also believe in functional interfaces, intuitive development workflows, and human usbaility.
That is to say that we don’t expect data engineers and anlysts to drop everything and learn Rust instead of familiar interfaces like SQL, Python etc. which they are used to. We don’t expect them to spend too much effort on infrastructure management, dependency management, CI/CD, version control which takes their focus away from data modelling, business logic development, data enrichment, schema managemnt, and creating insights from the data.
What is InfinyOn? Who is it for?
What: InfinyOn is an end to end streaming analytics platform for software engineers who deeply understand data and data engineers who deeply understand software.
Who: InfinyOn is for builders of data intensive application who are willing to embrace rigorous and disciplined pogramming paradigms in Rust, while working with familiar patterns of SQL, Python, and JavaScript.
Stay in Touch:
If you want a refined efficient data processing system to power end to end streaming analytics, let us know by filling out this form.
- Share your thoughts on our Github Discussions
- Join the conversation on Fluvio Discord Server
- Subscribe to our YouTube channel for project updates.
- Follow us on Twitter for the latest news.
- Connect with us on LinkedIn for professional networking.
