Use Cases
Docs
Blog Articles
BlogResources
Pricing
PricingReal-time analytics on UE5 games using InfinyOn

VP Product, InfinyOn Inc.

Introduction
Last year we spent a while getting into gaming analytics nudged by builders with experience at household name gaming and entertainment plays like Sony Online Entertainment, Sony Interactive Entertainment, Zynga, Activision Blizzard as well as niche plays like Netboxify, Thrilltech, Greatest Debate, Evolution, Danske Spil, Mistplay, etc.
We built out an end to end analytics flow with a synthetic data generator to push real-time events into fluvio topics and run live analytics using stateful dataflow as a conversation starter.
I started writing about the project but there was one big thing missing in the flow. Real Data!
Thanks to Alan Chen, now we have a Unreal Engine 5 plugin that we are about to publish in the Unreal Engine marketplace aka. FAB for developers to use in their game for live analytics. This plugin solves the problem of real data, and gives us a neat demo, and a reason to share this pattern with all of you.
What’s the Big Idea?
Let’s say you have a game built on UE5. And you need a system which tracks player events, game events (with permission obviously) to process, visualize, and get insights from the live events. That’s the pattern we observed with game developers building RPG style games, rewards, loyalty, eSports, casinos, etc. And this demo is a simple illustration of the gaming analytics pattern.
Using InfinyOn Cloud, we:
- Stream player and game events via websocket gateway.
- Process these events with stateful dataflow.
- Visualize them using Apache ECharts.
This isn’t just about cool visuals, it’s about turning raw telemetry into live dashboards and real-time intelligence. And doing it on a reliable high performance engine which offers extremely low latency, minimal idle resource consumption, and scales up and out on demand to deal with heavy concurrent traffic and data processing workloads.
The Setup: InfinyOn Cloud and UE5 InfinyOn Analytics Plugin
InfinyOn Cloud is a system designed to handle real-time event streams with ease. For this demo, I used a fluvio cluster with 3 data flows, 1 produce key to capture the live game data from a demo UE5 game and 2 consume keys to visualize the processed data.
Here’s how it all comes together:
- UE5 Plugin: The InfinyOn Analytics plugin for UE5 is added into the game to capture and stream game events using websocket gateway.
- Data Pipeline: The events from the game are stored in topics and they’re transformed using stateful dataflow operators.
- Dashboard: A simple dashboard consumes and plots the data real time on a web app using Apache ECharts.
Let’s break it down step-by-step.
Step 1: Configuring the UE5 Plugin
Integrating a Unreal Engine 5 game involves 3 steps. Install the InfinyOn Analytics plugin (available with a handy README). Configure it with a WebSocket gateway producer key from InfinyOn Cloud. The final step is to configure the analytics events including the schema, the types of events and the payload that the game will send to the Fluvio topics.
To define events in UE5 games there is sufficient documentation available on Epic Games Official Site. Configure the events to track.
Start a fluvio cluster on InfinyOn Cloud, launch the dataflows and its time to configure the UE5 InfinyOn Analytics Plugin and the live dashboard.
To Configure the Plugin, we need:
- 3 websocket keys, 1 to produce events, 2 to consume events following the guide to use websocket gateway:
fluvio cloud access-key create key-name --topic topic-name --produce/consume
- Open
DefaultEngine.iniin UE5 project’s config folder. - Add the key to the plugin settings:
[InfinyonAnalytics]
ApiKey=enter-key-here
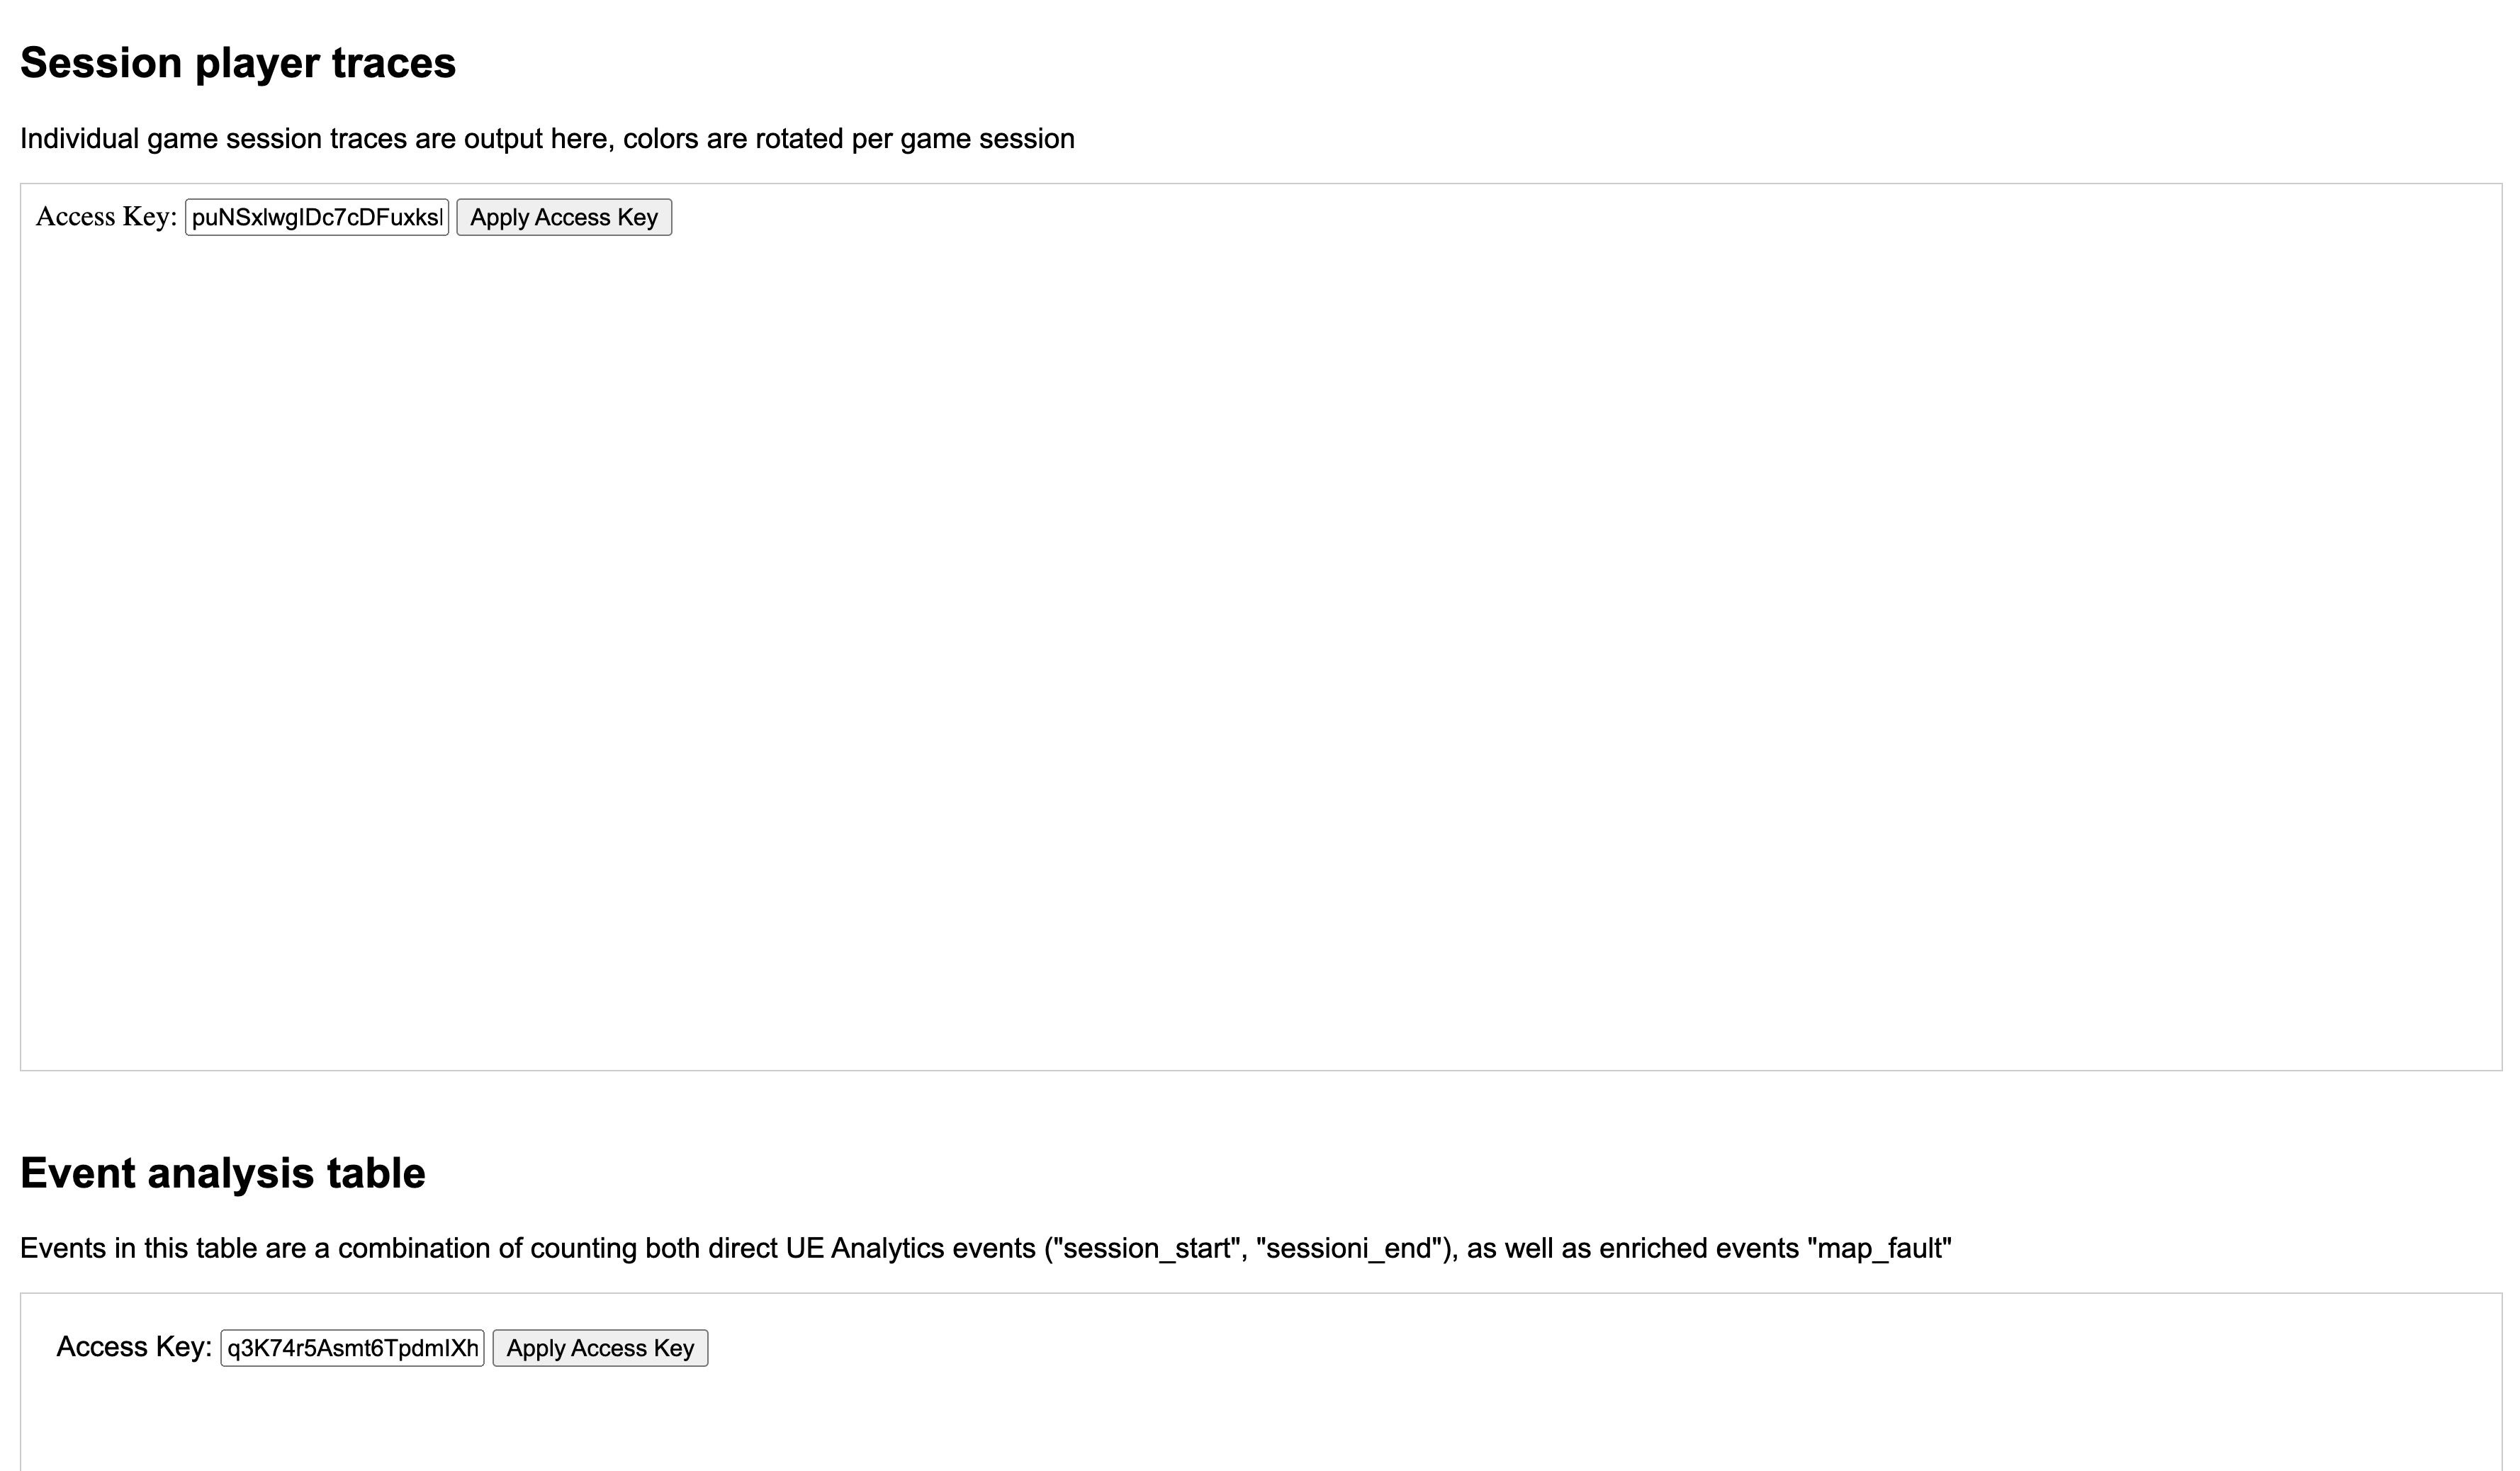
- Launch the live dashboard and add the consume keys in the respective charts as in the image.
The game streams events when launched. The plugin handles the rest, pushing player sessions, movements, locations, or map faults to a designated topic in InfinyOn Cloud.
Step 2: Transforming and Materializing Data
Once the game is running, events flow into the designated topic on InfinyOn Cloud. We have three data flows to process this data:
- Map Events: Extracts player location data (X, Y coordinates) and maps it for visualization.
- Counters: Standardizes events (e.g., jumps, faults) and counts them and updates the counts in a table.
- Table Sink: Gets the aggregates of events count in a tumbling window aka. materialized views and updates a table in the dashboard web app.
These flows use stateful dataflow packages to parse the event schema. For example, a sample event payload might look like this:
{
  "event_name": "jump",
  "location": {"x": 120.5, "y": 75.2},
  "timestamp": "2025-03-18T10:00:00Z"
}
The Map Events dataflow applies a map operator to format the incoming payload using a analytics package:
apiVersion: 0.5.0
meta:
  name: map-event
  version: 0.1.0
  namespace: unreal

imports:
  - pkg: fluvio/[email protected]
    functions:
      - name: ue-evt-map

dev:
  imports:
    - pkg: fluvio/[email protected]
      path: ../../packages/ue-analytics-core

config:
  converter: raw

  consumer:
    default_starting_offset:
      value: 0
      position: Beginning

# types:
#   nada:
#     type: string

topics:
  analytics-src:
    name: tudi-analytics
    schema:
      value:
        type: bytes

  analytics-snk:
    name: tudi-analytics-events
    schema:
      value:
        type: string

services:
  converter:
    sources:
      - type: topic
        id: analytics-src

    sinks:
      - type: topic
        id: analytics-snk

    transforms:
      - operator: map
        uses: ue-evt-map
The Counters dataflow applies a map operator to format the incoming payload using a analytics package:
apiVersion: 0.5.0
meta:
  name: counters
  version: 0.1.0
  namespace: unreal

config:
  converter: json
  consumer:
    default_starting_offset:
      value: 0
      position: Beginning

imports:
  - pkg: fluvio/[email protected]
    types:
      - name: attribute
      - name: attribute-list
      - name: analytics-event
  - pkg: fluvio/[email protected]
    functions:
      - name: tudi-counter-enhance

dev:
  imports:
    - pkg: fluvio/[email protected]
      path: ../../packages/ue-analytics-core
    - pkg: fluvio/[email protected]
      path: ../../packages/ue-tudi-analytics
# types:

topics:
  analytics-src:
    name: tudi-analytics-events
    schema:
      key:
        type: string
      value:
        type: analytics-event

  analytics-enriched:
    name: tudi-analytics-enriched
    schema:
      value:
        type: analytics-event

services:
  event-enrich:
    sources:
      - type: topic
        id: analytics-src
    sinks:
      - type: topic
        id: analytics-enriched

    transforms:
      - operator: flat-map
        uses: tudi-counter-enhance

  event-counter:
    sources:
      - type: topic
        id: analytics-enriched
    # sinks:
    #   - type: topic
    #     id: analytics-count

    # key: event_type
    states:
      event-count-tbl:
        type: keyed-state
        properties:
          key:
            type: string
          value:
            type: arrow-row
            properties:
              count:
                type: u64

    partition:
      assign-key:
        run: |
          fn assign_count_key(evt: AnalyticsEvent) -> Result<String> {
            let label = match evt.event_name.as_str() {
              "AnalyticsSessionStart" => "session_start",
              "AnalyticsSessionEnd" => "session_end",
              "jump" => "jump",
              "sampleLocation" => "sample_location",
              "mapFault" => "map_fault",
              _ => "other",
            };
            Ok(label.to_string())
          }

      update-state:
        run: |
          fn update_count(_evt: AnalyticsEvent) -> Result<()>{
            let mut row = event_count_tbl();
            row.count += 1;
            row.update()?;
            Ok(())
          }
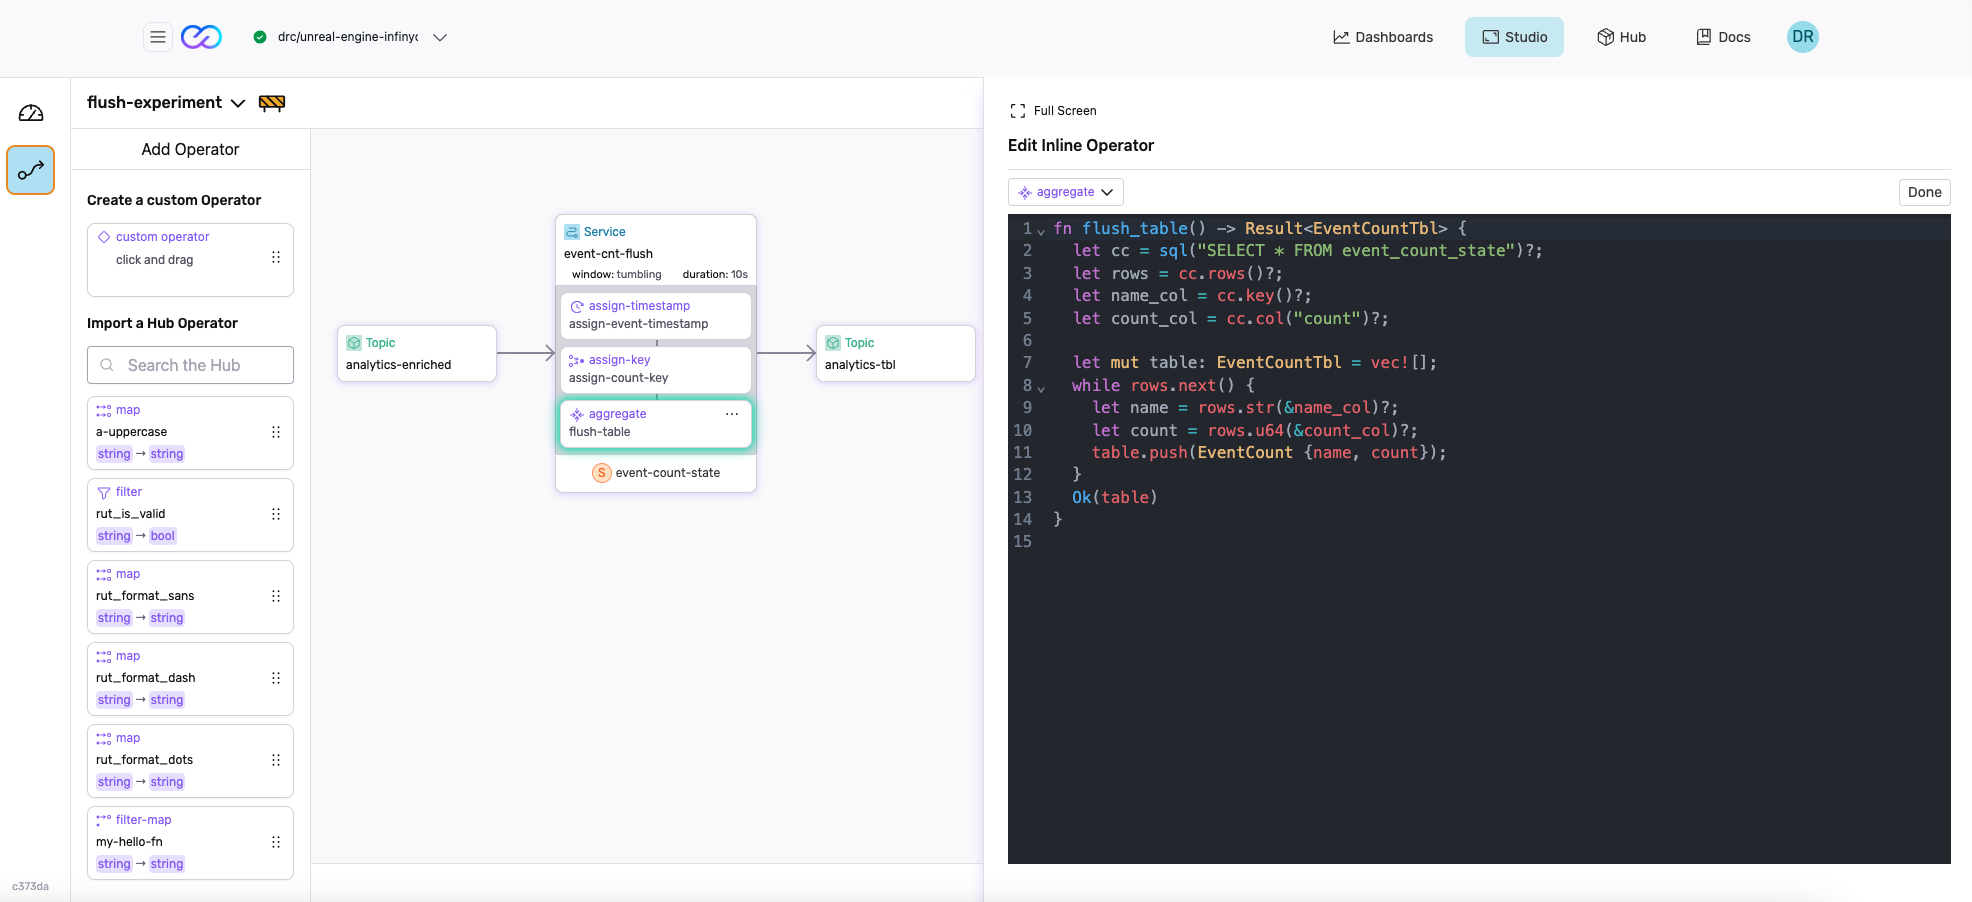
The Flush dataflow applies a 10 second tumbling window operator to materialize the events into a table:
apiVersion: 0.5.0
meta:
  name: flush-experiment
  version: 0.1.0
  namespace: unreal

config:
  converter: json
  consumer:
    default_starting_offset:
      value: 0
      position: Beginning

imports:
  - pkg: fluvio/[email protected]
    types:
      - name: attribute
      - name: attribute-list
      - name: analytics-event
  - pkg: fluvio/[email protected]
    functions:
      - name: tudi-counter-enhance

dev:
  imports:
    - pkg: fluvio/[email protected]
      path: ../../packages/ue-analytics-core
    - pkg: fluvio/[email protected]
      path: ../../packages/ue-tudi-analytics


types:
  event-count:
    type: object
    properties:
      name:
        type: string
      count:
        type: u64

  event-count-tbl:
    type: list
    items:
      type: event-count


topics:
  analytics-enriched:
    name: tudi-analytics-enriched
    schema:
      value:
        type: analytics-event

  analytics-tbl:
    name: tudi-analytics-tbl
    schema:
      key:
        type: string
      value:
        type: event-count-tbl

services:
  event-cnt-flush:
      sources:
        - type: topic
          id: analytics-enriched
      sinks:
        - type: topic
          id: analytics-tbl

      states:
        event-count-state:
          type: keyed-state
          properties:
            key:
              type: string
            value:
              type: arrow-row
              properties:
                count:
                  type: u64

      window:
        tumbling:
          duration: 10s

        assign-timestamp:
          run: |
            fn assign_event_timestamp(_evt: AnalyticsEvent, event_time: i64) -> Result<i64> {
              Ok(event_time)
            }

        partition:
          assign-key:
            run: |
              fn assign_count_key(evt: AnalyticsEvent) -> Result<String> {
                let label = match evt.event_name.as_str() {
                  "AnalyticsSessionStart" => "session_start",
                  "AnalyticsSessionEnd" => "session_end",
                  "jump" => "jump",
                  "sampleLocation" => "sample_location",
                  "mapFault" => "map_fault",
                  _ => "other",
                };
                Ok(label.to_string())
              }

          update-state:
            run: |
              fn update_count(_evt: AnalyticsEvent) -> Result<()>{
                let mut row = event_count_state();
                row.count += 1;
                row.update()?;
                Ok(())
              }

        flush:
          run: |
            fn flush_table() -> Result<EventCountTbl> {
              let cc = sql("SELECT * FROM event_count_state")?;
              let rows = cc.rows()?;
              let name_col = cc.key()?;
              let count_col = cc.col("count")?;

              let mut table: EventCountTbl = vec![];
              while rows.next() {
                let name = rows.str(&name_col)?;
                let count = rows.u64(&count_col)?;
                table.push(EventCount {name, count});
              }
              Ok(table)
            }
These flows run continuously as new events are streamed and process and update the visualization real-time.
The functions and the packages are all available in this Git Repo: https://github.com/infinyon/stateful-dataflows-examples/tree/main/dataflows/unreal-engine-analytics
Step 3: Building the Dashboard
The final piece is a real-time dashboard. its a simple HTML file that consumes data from InfinyOn Cloud using websocket consumer keys (GameEvents and MapEvents). The dashboard features:
- Player Traces: A map showing player movements with colored dots for different sessions.
- Event Table: A summary of event counts (e.g., jumps, faults, session starts).
The 3 html files are in this Git Repo Location: https://github.com/infinyon/stateful-dataflows-examples/tree/main/dataflows/unreal-engine-analytics/visualizations
All that we do is to open the file in a browser, apply the consumer keys, and watch the dashboard come alive as the game runs.
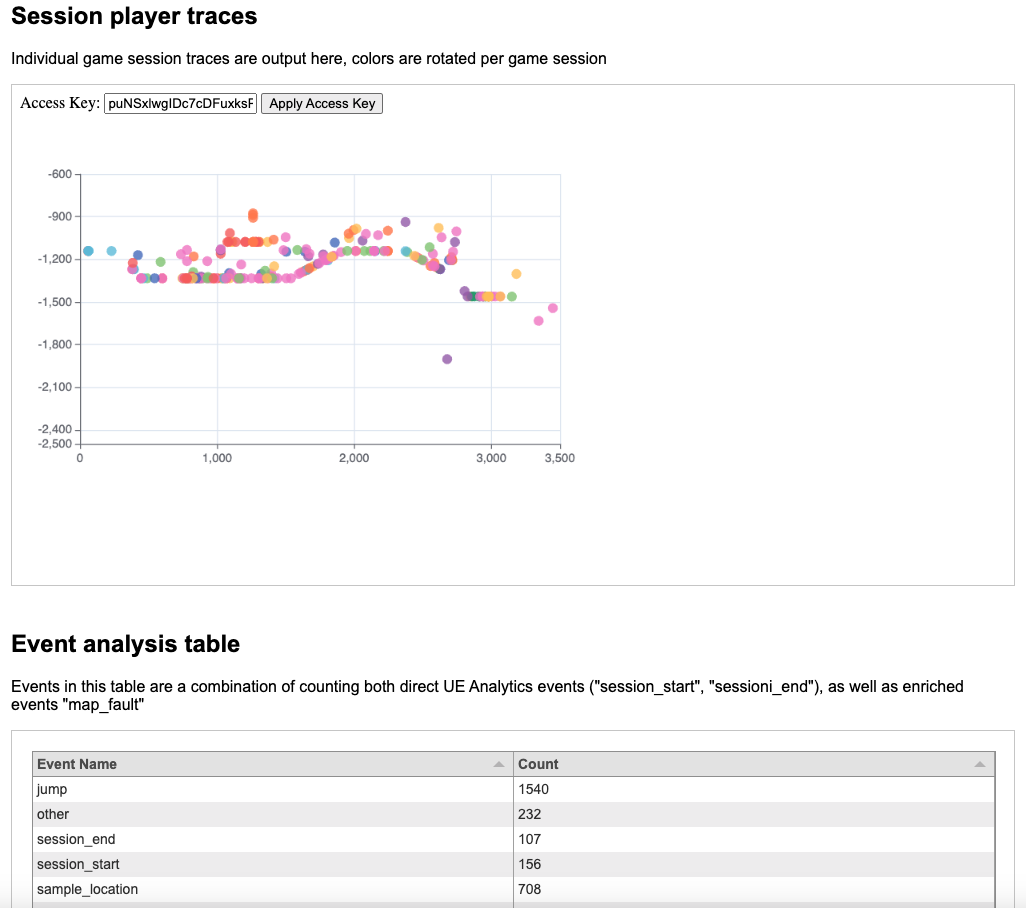
Playing the Game: Real-Time Results
With everything set up, I launched the UE5 demo game. As I moved around, jumped, and occasionally fell off the map (oops!), the dashboard updated in real time:
- Colored dots traced my initial session’s movements.
- A new session appeared in a different color, reflecting the trajectory of movements of different gameplays in different colors.
- Every 10 seconds, the data flows materialized the latest counts, keeping the dashboard updated with the insights based on the game events and player movements.
Why InfinyOn Cloud?
InfinyOn Cloud supercharges event streaming applications without the infrastructure overheads. It handles significant data volumes, processes events in real time, and goes from event sources like UE5 games to intelligent applications like live dashboards, alerts, AI powered enrichment etc.
If you’re building intelligent data intensive applications for games, high frequency trading, crypto markets, ad tech, ecommerce, industrial automation based on IoT - InfinyOn is a lean, efficient data platform that will make your project more scalable, secure, reliable, reduce infrastructure overheads, and increase development velocity.
Get Started Yourself
Ready to try this out? Here’s what you need:
- InfinyOn Cloud account: visit InfinyOn Cloud to request access.
- We will announce it once we publish the UE5 InfinyOn Analytics plugin.
- You can try this DataFlow using the demo game and the dataflows as a starting point.
Game repo with InfinyOn Analytics Plugin: https://github.com/fluvio-community/TuDiAnalyticsTest
Stateful DataFlow with Packages, DataFlow, Visualizations: https://github.com/infinyon/stateful-dataflows-examples/tree/main/dataflows/unreal-engine-analytics
Setup docs: https://www.fluvio.io/docs/cloud/quickstart
Have questions or feedback? Email me at [email protected]. I’d love to hear what you think!
Conclusion
From a UE5 game to a real-time analytics dashboard, this demo shows how to get it going on InfinyOn Cloud. It’s not just about collecting data—it’s about turning it into insights instantly. Reach out to us if you want to build similar data flows and event driven applications.
If you’d like to see how InfinyOn Cloud could level up your data operations - Just Ask.
- Share your thoughts on our Github Discussions
- Join the conversation on Fluvio Discord Server
- Subscribe to our YouTube channel for project updates.
- Follow us on Twitter for the latest news.
- Connect with us on LinkedIn for professional networking.